Myfitnesspal Reports Bookmarklet
I’m proud to announce, the first version of the Myfitnesspal Report Bookmarklet! It’s a bit of code that you run on Myfitnesspal, which pulls in all your data for the last year, and displays pretty interactive graphs for you.
To use it just drag this to your browsers bookmark toolbar: [Myfitnesspal Report Bookmarklet][2]
It turned their boring flash graphs:
[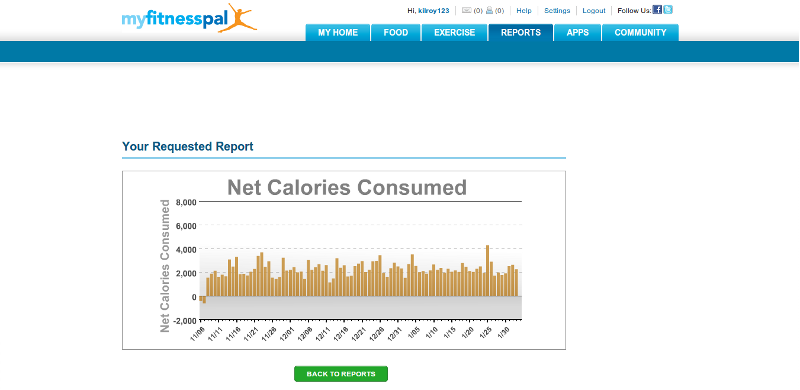 ][3]
][3]
Into this!
[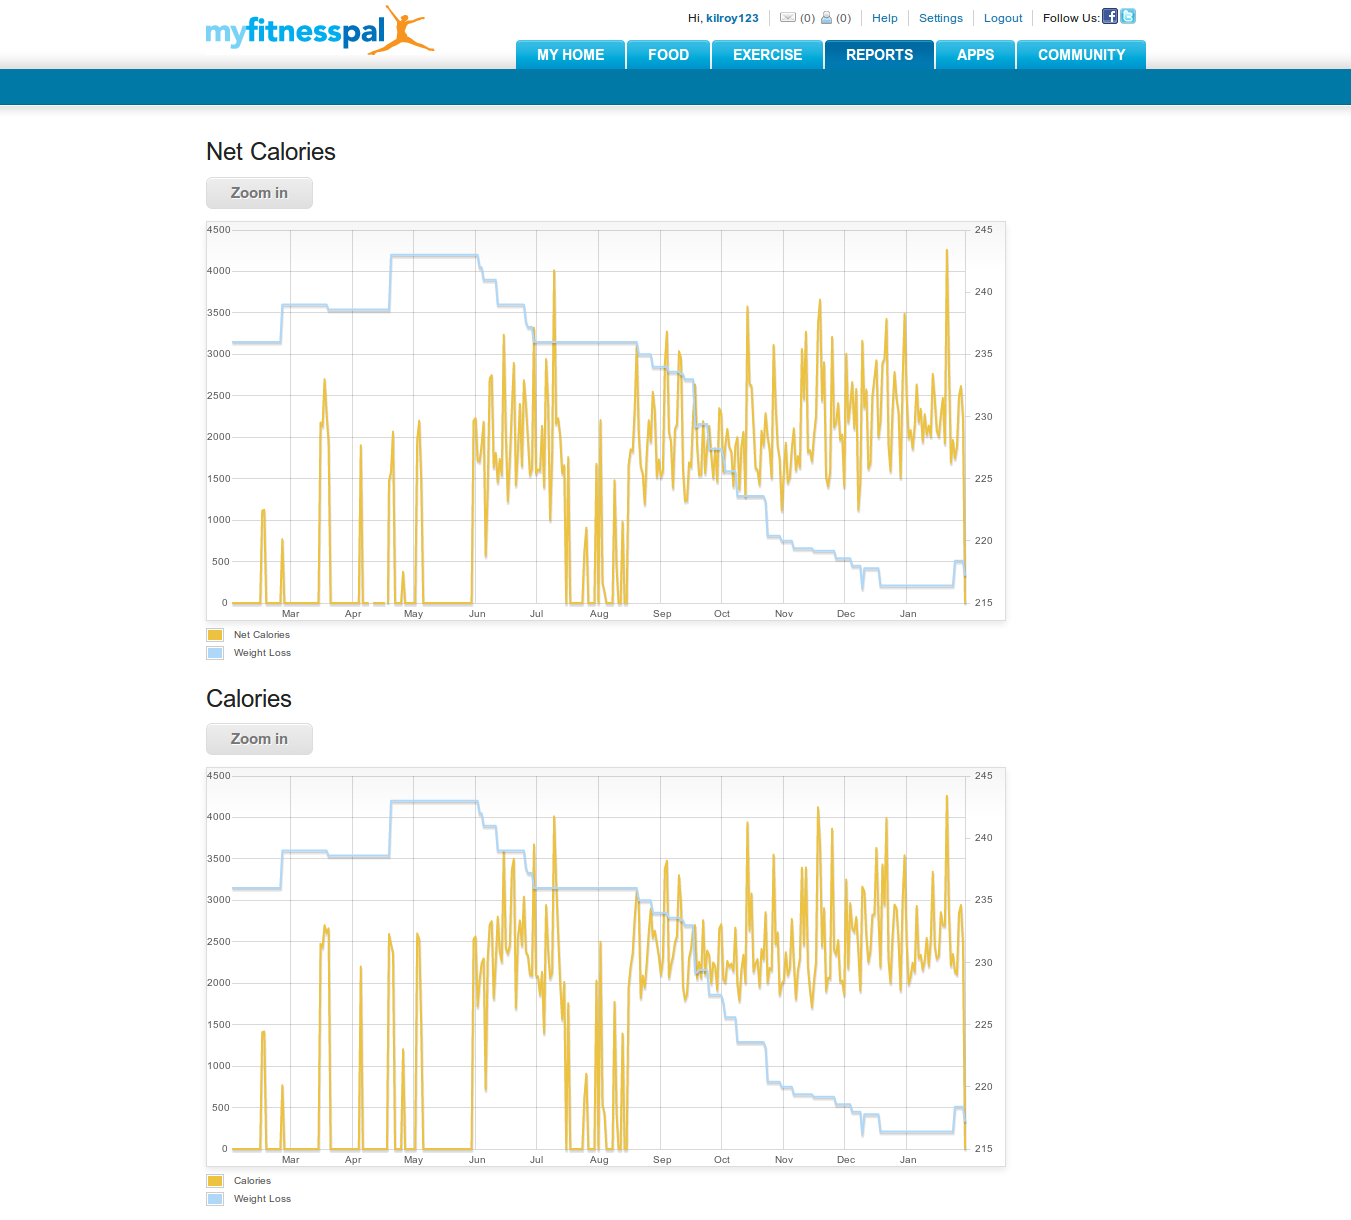 ][4]
][4]
You can zoom into the graph to see a range of months, weeks, and days.
Or you can select a date on the graph and view that days diary entry. I think this is a fine improvement to the current — see one flash graph at a time.
The code is on github and is open-sourced! https://github.com/stevenirby/myfitnesspal-reports
[2]: javascript:(function(){function addScript(src,cb){var script=document.createElement(‘script’);script.src=src;document.documentElement.appendChild(script);}addScript(‘https://raw.githubusercontent.com/stevenirby/myfitnesspal-reports/master/nutrition.js');})(); [3]: https://www.stevenirby.me/wp-content/uploads/2013/02/before.png [4]: https://www.stevenirby.me/wp-content/uploads/2013/02/after2.png